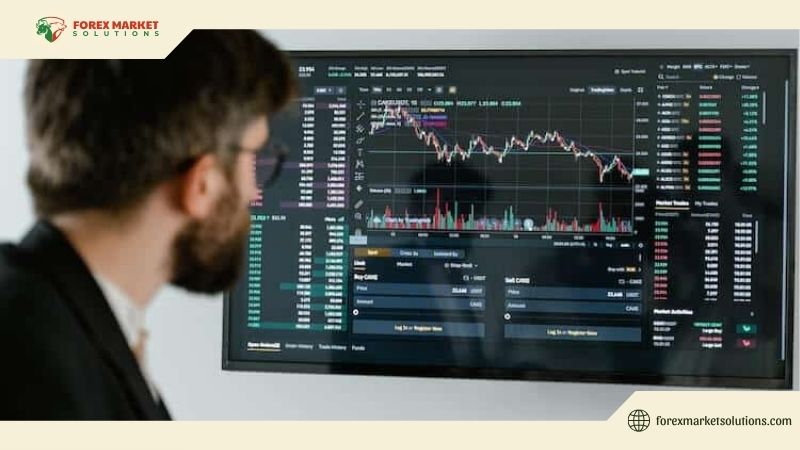
In the fast-evolving world of financial markets, efficiency and precision are key to staying ahead, especially for traders navigating the complexities of Forex, stocks, or cryptocurrencies. One powerful way to achieve this is to trade from chart, a feature that allows you to execute trades directly from your price charts without toggling between screens. Platforms like TradingView have perfected this functionality, blending robust charting tools with seamless trade execution, making it a favorite among traders in 2025. As markets grow more volatile with economic shifts and technological advancements, mastering this technique can streamline your workflow and sharpen your decision-making. This comprehensive guide explores how to trade from chart, offering practical steps to harness TradingView’s capabilities for success.

The ability to trade from chart transforms the trading experience, merging analysis and action into a single, intuitive process. In 2025, with real-time data at your fingertips and brokers increasingly integrating with platforms like TradingView, this method empowers traders to react swiftly to market movements—whether it’s a breakout in EUR/USD or a dip in Bitcoin. From setting up your charts to placing orders with a click, this article provides a clear roadmap to leverage this feature, ensuring you capitalize on opportunities as they unfold. Whether you’re a beginner or a seasoned trader, understanding how to trade from chart is a skill worth mastering in today’s dynamic markets.
The Power of Trading Directly from Charts
To appreciate why you should trade from chart, it’s worth understanding its advantages. Traditional trading often involves separate steps—analyzing a chart, switching to an order window, and manually inputting details. This disconnect can slow you down, especially in fast-moving markets where seconds matter. Trading from a chart eliminates these hurdles, letting you act on your analysis instantly. You spot a trendline break, click to place an order, and execute—all within the same interface.
This efficiency shines in volatile conditions, like 2025’s expected swings from central bank policies or crypto rallies. Imagine watching USD/JPY on a 1-hour chart; as it nears a resistance at 148.00, you can buy or sell directly from that level without leaving the chart. This seamless integration reduces errors—say, mistyping a price—and keeps your focus on price action. Platforms like TradingView enhance this with customizable tools, making trade from chart a game-changer for precision and speed.
Beyond speed, it aligns analysis with execution. Your chart—loaded with indicators like RSI or Fibonacci—becomes your command center, reflecting your strategy in real time. This unity boosts confidence, a critical edge in markets where hesitation can cost profits.

Setting Up TradingView to Trade from Chart
Before you can trade from chart, you need to prepare TradingView for action. Start by linking your broker account—TradingView supports partners like FOREX.com, OANDA, or Interactive Brokers, with more joining in 2025. Log into TradingView, navigate to the “Trading Panel” at the screen’s bottom, and select your broker. Authenticate your credentials, and your account balance and positions sync up, ready for live trading.
Next, customize your chart. Open a pair like EUR/USD or a stock like Tesla, choosing a timeframe—15-minute for scalping, daily for swings—that suits your style. Add indicators—say, a 50-day moving average or Bollinger Bands—to guide your decisions. Right-click the chart to ensure “Trading” options are enabled; you’ll see a “Plus” icon or order menu appear. This setup transforms your chart into a live trading hub, the foundation for learning to trade from chart.
Test this in a demo mode if your broker offers it. Place mock trades—buy 0.1 lots of GBP/USD at 1.3000, set a stop at 1.2970—to get comfortable. This practice ensures you’re ready for real funds, minimizing rookie mistakes when you go live.
Trade from Chart: Step-by-Step Execution
Mastering trade from chart on TradingView involves a simple yet powerful process. Let’s walk through it with a Forex example—trading AUD/USD on a 4-hour chart. Suppose the pair drops to a support at 0.6650, forming a hammer candlestick, signaling a potential reversal. You decide to buy, aiming for 0.6750.
Hover over the chart at 0.6650, right-click, and select “Buy Market” or “Buy Limit” from the menu. A “Market” order executes instantly at the current price—say, 0.6652—while a “Limit” order waits for 0.6650, ideal if you expect a dip. A small window pops up; input your position size (e.g., 0.2 lots, or 20,000 units), set a stop-loss at 0.6600 (52 pips risk), and a take-profit at 0.6750 (98 pips gain). Click “Place,” and the trade activates, visible in the “Positions” tab below. You’ve just used trade from chart to enter with precision.
For a sell, flip the process. If AUD/USD nears resistance at 0.6800 after a rally, right-click, choose “Sell Market,” set 0.5 lots, a stop at 0.6850, and a target at 0.6700. The chart updates with your order lines—red for stop, green for profit—keeping everything visual. In 2025’s fast markets, this directness cuts delays, letting you ride trends or scalp spikes efficiently.
Adjusting trades works similarly. Click your position on the chart, drag the stop-loss to breakeven (0.6652) as price hits 0.6700, locking in gains. This hands-on control defines trade from chart, merging strategy with execution.

Enhancing Trades with Chart Tools
TradingView’s strength lies in its tools, amplifying how you trade from chart. Add Fibonacci retracement to AUD/USD’s drop from 0.6800 to 0.6650—if the 61.8% level (0.6742) aligns with your take-profit, it’s a stronger target. Plot support/resistance with horizontal lines; a buy at 0.6650 gains weight if it’s a past low. Alerts—set via the bell icon—ping you when price hits 0.6650, ensuring you don’t miss the moment.
Indicators like MACD or volume refine entries. A MACD crossover above zero post-hammer confirms bullish momentum, while a volume spike validates buyer strength. In 2025, with algo-trading driving quick moves, these cues sharpen your trade from chart decisions, blending analysis into action.
For advanced users, pine script lets you code custom signals—say, a buy alert when RSI dips below 30 then rises—triggering trades directly from the chart. This flexibility keeps TradingView cutting-edge, enhancing your workflow.
Avoiding Pitfalls When Trading from Chart
Even with its ease, trade from chart has traps. Overtrading is common—clicking impulsively on every wiggle risks losses. Stick to your plan—trade only high-probability setups like breakouts or reversals. Misclicks can hurt too; buying 1 lot instead of 0.1 by accident overexposes you—double-check sizes before confirming.
Ignoring fees is another misstep. Each trade incurs spreads or commissions—0.2 pips on EUR/USD adds up—so factor these into targets. In 2025’s competitive broker landscape, pick one with tight spreads to maximize trade from chart profits. Lastly, don’t skip confirmation—acting on a hunch without indicator support can backfire.

Practice and Mastery
Like any skill, trade from chart thrives with practice. Start on a demo—buy GBP/USD at a 1.2950 support, sell at 1.3050 resistance, tweaking stops and targets. Track results in a journal—did volume confirm? Did Fib help?—refining your eye. Move to live trades with micro-lots (0.01), scaling as you master it. In 2025’s volatile markets, this builds the muscle memory to act fast and smart.
Review weekly, adjusting based on data. If scalping outperforms swings, focus there. TradingView’s “Trade History” tab shows what works, guiding your growth.
Trade Smarter in 2025
Learning to trade from chart on TradingView revolutionizes your approach, uniting analysis and execution in one fluid motion. From setup to strategy, this method offers speed, precision, and control—vital in 2025’s unpredictable markets. Practice turns potential into profit, making every chart a canvas for success. Embrace trade from chart, and watch your trading soar.
For more tools and market wisdom, follow Forex Market Solutions—your guide to thriving in 2025 and beyond.
