You’ve asked, “How do economic indicators affect the stock market?” Here’s the simple truth: these indicators are the pulse that investors check to predict health and direction. They are not just numbers in reports – they shape the ups and downs in your investment portfolio. When GDP climbs, often, so do your stocks. But that’s just the tip of the iceberg. Dive in as I break down the connection between robust economic data and your stock market gains. Buckle up for a clear-eyed look at the threads that weave the economy with Wall Street’s fortune – it’s a ride you won’t want to miss!
The Nexus Between Economic Growth and Share Prices
Deciphering the Impact of GDP on Stocks
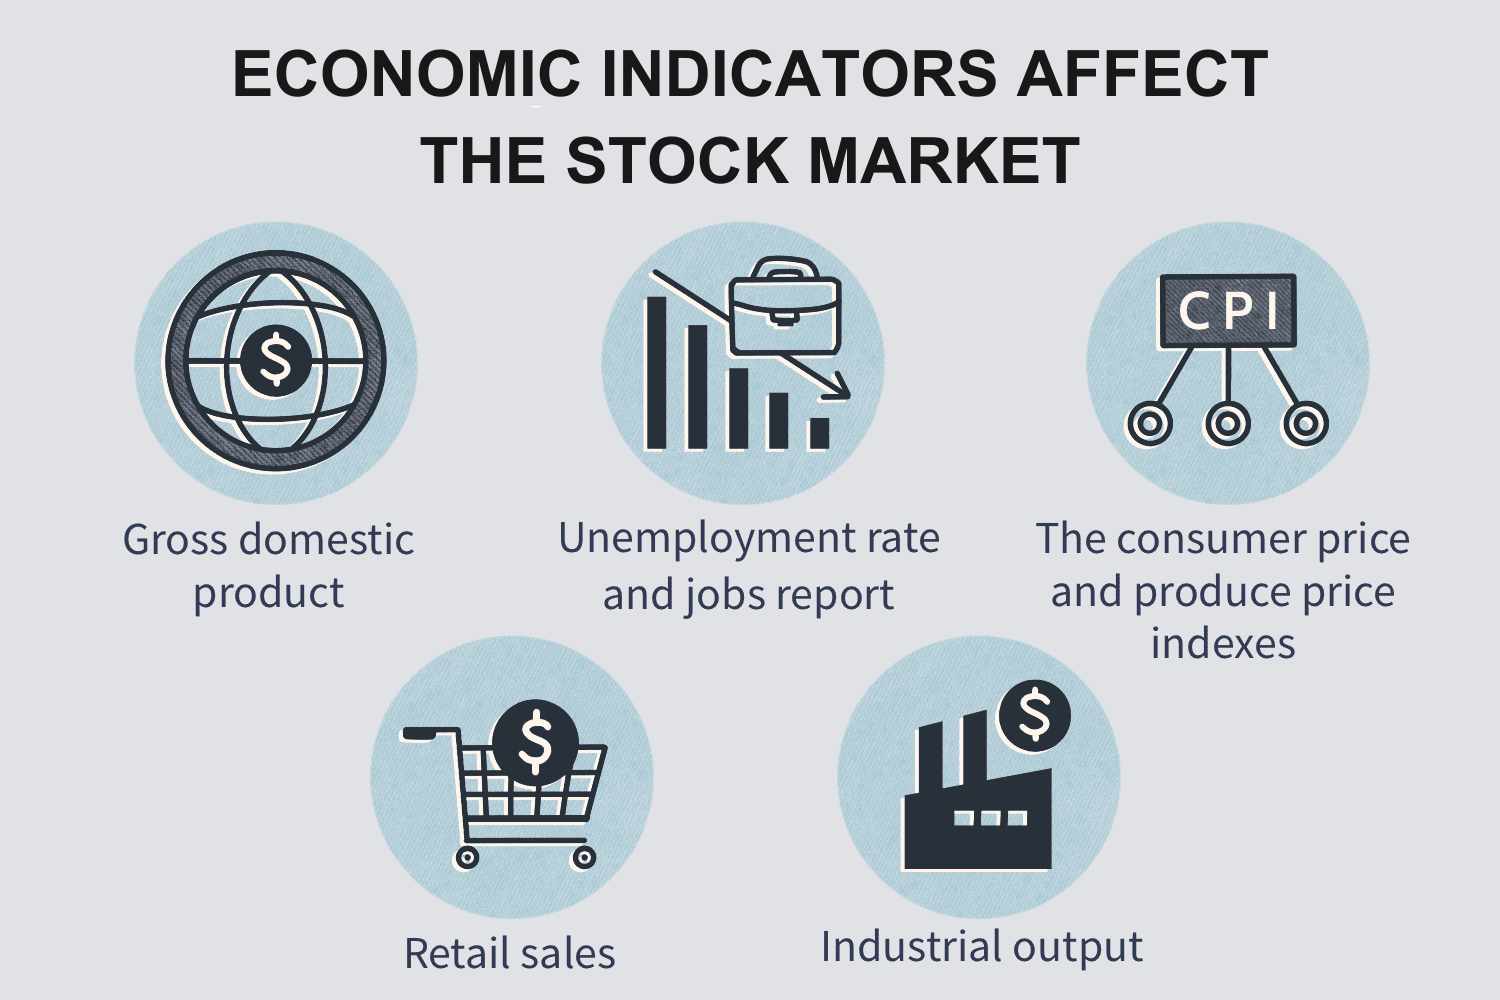
When a country’s total goods and services go up, so do stocks. This is the GDP, or Gross Domestic Product. It tells us how well a country’s economy is doing. When GDP is up, companies often make more money. This makes people want to buy more stocks; hence, stocks prices can rise. It makes sense, right? When our economy hums along, people have jobs, they spend money, and companies do well. This kind of good news often means stock prices may go up.
But it’s not just about how much we make. It’s also about how much more we make than before. If the GDP grows a lot, that’s great for stocks. But if it slows down or drops, that can be bad news for the market. It’s like when you get your grades—going from a B to an A is awesome and everyone’s happy. But if you slip from an A to a B, it feels a bit like a letdown. Stocks can feel the same way about GDP growth rates.
GDP Growth Rate Effects on Market Dynamics
How quickly the GDP grows can shake up the whole stock market. It’s like when a big wave comes at the beach. Surfers—the stocks—either ride it high or wipe out. We can tell if the economy and stocks might do well by looking at the GDP growth rate.
When the GDP growth rate is healthy, it tells us our economy is strong. Businesses expand, hire more people, and this often drives stock prices up. If the rate is too fast, though, we can get issues like higher prices for stuff we buy. That’s not so good. And if the GDP growth rate slows down or shrinks, that can signal trouble. Companies might sell less, and people might worry and sell their stocks. This can drive prices down.
In simple terms, think of the GDP growth rate as a speedometer for the economy. When it’s in the right range, the stock market engine runs smoothly. It can get bumpy if it speeds up too fast or slows down a lot. We, as investors or market watchers, really care about this rate.
These numbers show how our big economy machine is working. When those GDP reports come out, investors all over jump in or out of stocks, depending on what the numbers say. It’s a big deal in the stock world!
So, let’s remember, a growing GDP is often good for stocks. A fast-growing GDP can be a sign to buckle up for a fast ride. And when the GDP slows down, it might be time to hold on tight. By keeping an eye on that GDP report, we can get some serious clues about where the stock market might head next.
The Labor Market as a Mirror to Stock Market Fortunes
Analyzing Unemployment Rates for Market Trends
Jobs matter—a lot. When more folks have jobs, they spend money. This is good for businesses. So, when the unemployment rate drops, the stock market often goes up. Why? Because lower unemployment means more people are earning wages. This usually leads to more spending.
But it’s not just about the number of jobs. The quality of jobs plays a huge part too. Better jobs mean more cash in hand for families. And what do they do? They buy things, they go on trips, and they invest—that’s right, sometimes in stocks.
Market Reactions to Jobs Report and Employment Data Trading Strategies
Every month, the jobs report comes out. Right away, the stock market reacts. If the numbers are good, the market often gets a boost. If not, stocks might fall. Smart investors watch these reports closely. They build strategies on this data. Like bats ready to fly at dusk, they’re poised to act on the latest jobs data.
Let’s say the jobs report is better than expected. Investors might buy more stocks, betting that a strong job market means more profits for companies. But if the report is weak, they might sell. They fear that poor employment numbers could spell trouble for consumer spending – and therefore, for stocks.
But don’t forget, it’s not just about the numbers released today. It’s about how they stack up against what everyone thought would happen. If numbers are just a tiny bit better, that can still make investors happy because it’s a sign of growth.
Here’s a tip: keep an eye on certain sectors when jobs data rolls out. For example, if more construction jobs are added, companies that sell building materials might see their stocks go up.
Also, consider timing. The stock market can be quick to respond to job data, but sometimes the true impact takes a little longer to show. Think of it like planting a seed. You don’t see the bloom right away. In the stock market, this can be true for shifts in the labor market, too.
Using the jobs report to make smart moves takes practice. It’s like learning to read weather patterns before sailing the seas. Over time, you can get pretty good at predicting how the market will move with employment news. And who doesn’t like being right?
Remember, the stock market is like a web. Everything connects. And the labor market? It’s a big thread in that web. A change there can shake the whole system. So next time you hear about unemployment rates, look beyond the numbers. Think about what they mean for businesses, for families, and for the stock market. This insight could help you navigate the waters of investing with more confidence. And who knows, you might just make some smart moves that lead to a treasure chest brimming with profits.
Inflation and Monetary Policy: The Double-Edged Sword for Investors
Interpreting CPI and Stock Market Responses
Inflation hits us where it hurts: our wallets. The Consumer Price Index, or CPI, measures this. When CPI goes up, it often means stocks go down. Why? High CPI can signal the Federal Reserve to hike rates, making borrowing pricier for people and businesses. This can slow spending and hurt company profits.
Prices for goods and services can climb for lots of reasons. Sometimes, more people have jobs and can spend more. Other times, it’s hard to find what you need, pushing prices up. Investors watch CPI like hawks because it hints at future moves by the Fed. Stable prices can keep stocks steady. But if inflation runs high, stock values might fall as costs rise and people buy less.
Federal Reserve Announcements and Their Effect on Stock Valuations
When the Federal Reserve speaks, markets move. The Fed controls interest rates. Lower rates can fuel growth but spike inflation. Higher rates aim to tame inflation but may cool the economy. Investors listen closely to the Fed’s words. They use this info to guess what’s next for the market.
Federal Reserve announcements affect stocks through rate changes. If the Fed says it will raise rates, stocks often dip. That’s because expensive loans can slow big plans by companies. It can also make it costly for investors to buy on margin, which is like buying with a loan.
The Fed tries to keep the economy just right – not too hot, not too cold. Their announcements can either spook or boost investor confidence. Smart investors keep their ears open to adapt to these changes. Understanding the Fed’s hints can help you ride the stock market waves, no matter how wild they get. Remember, the key is to watch trends, and act with care. You can’t control the economy, but you can learn to surf its waves with skill.
Consumer Behavior and Industrial Activity: A Guiding Light for Equity Investments
Retail Sales Data Impact on Stocks and Investor Sentiment
How does retail sales data affect stock prices? When people buy more stuff, stocks often go up. Why? Because high retail sales show that people have money to spend and feel good about the economy. When folks feel good, they spend money, and that makes companies earn more. It’s like when your favorite ice cream shop is busy; you know it’s doing well.
Retail sales give clues about our economy’s health. Let’s think about something you might have seen. Ever notice how certain shops get more visitors during holidays? That’s retail sales going up. When many stores have more visitors, it means we’re all spending more. If we’re all spending, it’s good for stocks, since most companies sell things. So, if people buy more, companies might make more money, and their stock value may grow.
Now, imagine if suddenly, fewer people went to the shop. The shop might earn less, and it could be a sign that not everything is great with our money. If that happens everywhere, the stock market might drop. It’s like if the ice cream shop was empty on a hot day, something might be wrong. That’s why investors watch retail sales data so closely. They want to understand what might happen next with the market.
Manufacturing Data and PMI Insights for Stock Market Navigation
What is the PMI, and why should stock investors care? PMI stands for Purchasing Managers’ Index. Think of it like a report card for factories. When PMI numbers are big, it generally means factories are happy. They make more things, hire more people, and buy more stuff to make their products. Happy factories can mean the stock market has good times.
Factories are important for many reasons. They make the things we buy every day. If they make more things, it means people are buying. When factories do well, the companies that run the factories can do well too. This can make their stock prices rise. If factories make less, it might be a sign of trouble. It’s like watching a busy playground; if it’s full of kids, it’s a good day. If it’s empty, something might be up.
Investors look at PMI because it gives them hints about what’s coming. It’s about looking at signs and making smart guesses. If the PMI is strong, investors might decide to buy more stocks. They think the stock market will grow. If the PMI is weak, they might worry and sell stocks. They’re afraid the market might fall.
In short, strong retail sales and PMI numbers can lead to dancing in the stock market. Weak numbers might lead to a time-out. So we watch these indicators closely to try to figure out what might happen next with our investments. It’s a bit like checking the weather before a picnic. You want to know if it’s time for sun hats or rain boots for your stock portfolio picnic.
We dove deep into how the economy talks to the stock market. We saw GDP can push stock prices. Jobs reports show where stocks might go. Inflation and central bank choices can cut both ways for your money. What folks buy and factories make also guide your investments.
My final take? Know these signs to make smart moves. Watch the economy to pick winning stocks. Use each hint—jobs, sales, even how much stuff costs. It all matters. And now, you’re set to make those savvy investor plays. Happy trading!
Q&A :
How do economic indicators impact stock market performance?
Economic indicators are vital tools that provide insights into the health of an economy. Key indicators such as GDP growth rates, unemployment figures, inflation rates, and consumer spending can heavily influence stock market performance. Positive data often stimulates investor confidence, potentially leading to a rise in stock prices, as prospects for earnings growth improve. Conversely, negative indicators can spur sell-offs as investors anticipate a downturn in economic conditions and potential decreases in corporate profitability.
Which economic indicators should investors watch to predict stock market trends?
Investors looking to predict stock market trends typically monitor several key economic indicators. Among the most influential are:
- GDP Growth Rate: Reflects the overall economic growth and can indicate whether the economy is expanding or contracting.
- Unemployment Rate: A lower rate is usually a positive sign, suggesting a strong labor market and consumer spending potential.
- Inflation (CPI and PPI): Inflation rates can affect consumer purchasing power and corporate profit margins, influencing stock prices.
- Interest Rates and Federal Reserve Policies: The Fed’s stance on monetary policy can influence borrowing costs and economic activity.
- Consumer Confidence Index (CCI): A high level of consumer confidence usually translates to increased spending and can be a precursor to higher stock prices.
Can leading and lagging economic indicators predict stock market crashes?
Leading indicators, such as stock market returns, manufacturing activity, and the money supply, can sometimes give advance warnings of an economic slowdown or impending stock market correction. Lagging indicators, like unemployment and GDP, confirm trends but do not predict them. While no indicator can predict stock market crashes with certainty, a combination of these can help investors understand economic trends and potentially brace for market volatility.
What is the correlation between interest rates and the stock market?
Interest rates have a significant correlation with the stock market. Generally, when interest rates are low, borrowing costs decrease, making it cheaper for businesses to finance operations and expansion, which can lead to higher stock prices. Conversely, when interest rates rise, borrowing becomes more expensive, which can slow down economic growth and lead to lower stock market returns. Additionally, higher interest rates make bonds and savings accounts more attractive, potentially drawing investments away from the stock market.
How do international economic indicators affect domestic stock markets?
International economic indicators can significantly affect domestic stock markets through the interconnectedness of global economies. For instance, strong economic growth in major trading partners can lead to increased demand for exports, boosting domestic companies’ earnings. On the other hand, economic turmoil in another country can lead to risk aversion and negatively impact stock markets worldwide. Furthermore, global indicators like oil prices, global GDP growth, and international trade balances can have widespread implications for domestic stock markets due to the global nature of modern businesses and supply chains.


