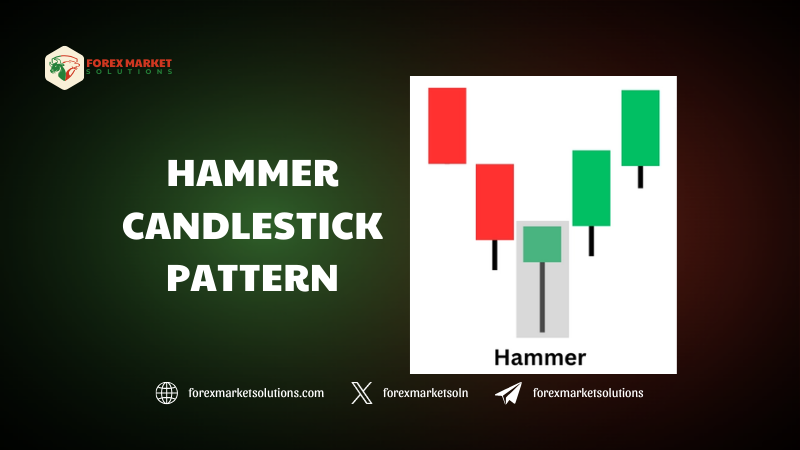
Candlestick patterns are the heartbeat of technical analysis, offering traders a visual language to interpret market sentiment and predict price movements. Among these, the hammer candlestick pattern shines as a potent signal, particularly for those seeking reversals in the fast-paced markets of 2025. Characterized by its distinctive shape—a small body with a long lower wick—this pattern often emerges at the bottom of a downtrend, hinting at a shift from selling pressure to buying strength. For Forex traders, stock enthusiasts, or crypto speculators, understanding this formation can unlock opportunities to enter trades at optimal points. This detailed guide explores the hammer candlestick pattern, breaking down its anatomy, significance, and practical trading applications in the evolving financial landscape of 2025.
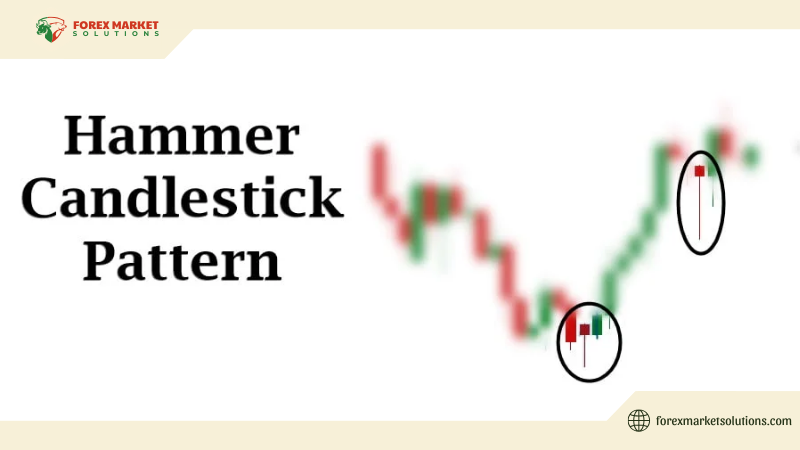
The beauty of the hammer candlestick pattern lies in its simplicity and reliability, reflecting a moment where buyers step in to halt a decline. In a year marked by economic fluctuations, central bank decisions, and technological trading advancements, recognizing this pattern becomes a valuable skill for navigating volatility. Whether you’re a novice learning to read charts or an experienced trader refining your edge, this article offers a clear path to identifying and leveraging the hammer candlestick pattern, empowering you to make informed decisions with confidence.
Anatomy of the Hammer Candlestick
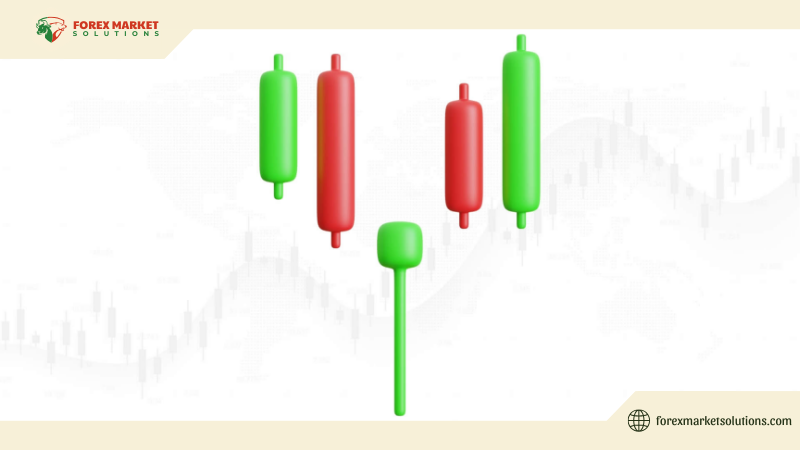
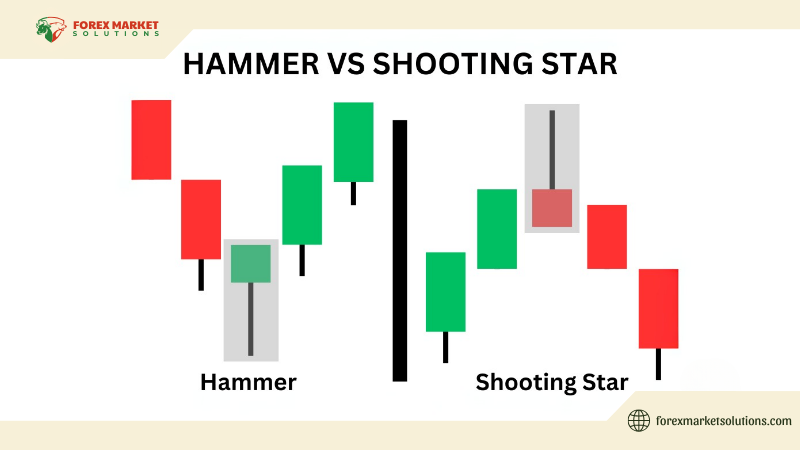
To harness the hammer candlestick pattern, it’s crucial to first understand its structure. This pattern appears on a price chart as a single candlestick with a small real body—where the open and close prices are close together—positioned near the top of the candle’s range. Below this body extends a long lower wick, typically at least twice the length of the body, showing that prices dipped significantly during the period but recovered by the close. The upper wick, if present, is short or nonexistent, emphasizing the rejection of lower prices.
This formation typically emerges after a downtrend, signaling that sellers pushed prices down, only for buyers to surge in and drive them back up. The long lower wick represents this battle, with buyers ultimately gaining the upper hand. In Forex, for instance, a hammer might form on the EUR/USD daily chart after a week of declines, with the price dropping to 1.0950 before closing near 1.1000. This visual cue is the essence of the hammer candlestick pattern, a snapshot of market psychology hinting at a potential reversal.
The color of the body—green (bullish, close above open) or red (bearish, close below open)—matters less than its position and wick. A green hammer suggests stronger buying conviction, but a red one can still signal reversal if confirmed by context. This flexibility makes the pattern adaptable across markets and timeframes.
Spotting the Hammer in Market Context
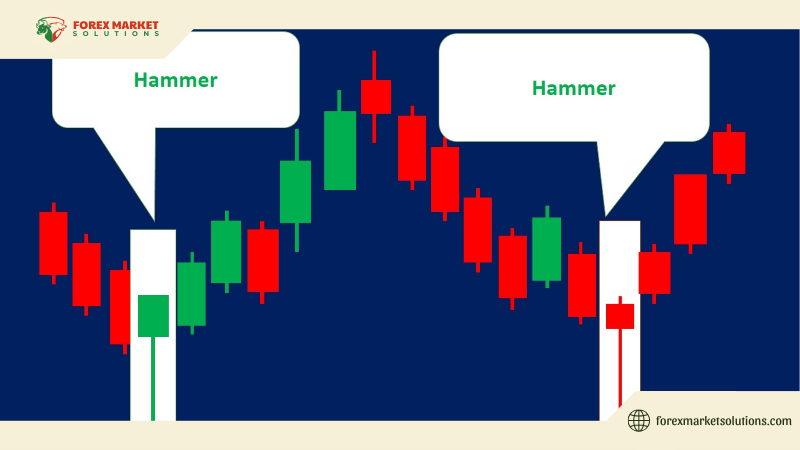
Identifying the hammer candlestick pattern requires more than just recognizing its shape—it demands context. The pattern’s power lies in its location, ideally at the end of a sustained downtrend. Scan your chart—whether a 1-hour frame for scalping or a daily one for swing trading—for a series of declining candles. The hammer should appear as a stark contrast, with its long lower wick piercing below recent lows before rebounding.
Take GBP/USD as an example. After falling from 1.3100 to 1.2900 over days, a candle forms with an open at 1.2910, a low of 1.2870, and a close at 1.2905. The lower wick (40 pips) dwarfs the body (5 pips), and the upper wick is minimal. This is a classic hammer, suggesting buyers are stepping in. In 2025, with volatility from Brexit echoes or US economic data, such setups could signal key turning points, making the hammer candlestick pattern a trader’s ally.
Volume can enhance this identification. A spike in trading volume on the hammer day—visible on platforms like TradingView—indicates strong buying interest, bolstering its reliability. Without a clear downtrend beforehand, though, the pattern loses meaning; a hammer in a sideways or uptrend is just noise. Context is king when spotting this formation.
Hammer Candlestick Pattern: Trading Strategies
Trading the hammer candlestick pattern effectively involves turning its signal into action. As a bullish reversal indicator, it’s a buy signal, but timing and confirmation are key. Let’s explore a practical approach using USD/JPY on a 4-hour chart. After dropping from 148.00 to 145.50, a hammer forms with an open at 145.60, a low of 145.20, and a close at 145.65. The long wick (40 pips) and tiny body (5 pips) scream reversal potential.
Wait for confirmation—typically the next candle closing above the hammer’s high (145.65). Enter a buy trade at, say, 145.70, placing a stop-loss below the hammer’s low (145.10) to limit risk (60 pips). Measure the prior downtrend’s height—148.00 to 145.50 is 250 pips—and project half or full distance upward from the breakout for a target (146.95 or 148.20). This 1:2 or 1:3 risk-reward ratio—60 pips risked for 125-250 pips gained—makes the trade worthwhile. In 2025’s trend-driven markets, fueled by yen policy shifts, this strategy leverages the hammer candlestick pattern for profit.
For scalpers, a tighter setup works. On a 15-minute EUR/USD chart, a hammer after a dip from 1.1020 to 1.0990—open at 1.0995, low at 1.0980, close at 1.0997—signals a quick reversal. Buy above 1.0997 with a stop at 1.0978 (19 pips risk), targeting 1.1016 (double the risk). The fast pace suits 2025’s algo-influenced volatility, turning small moves into gains.
Confirmation tools refine this. A bullish engulfing candle following the hammer, or an RSI rising from oversold (below 30), strengthens the signal. Volume surge on the hammer or breakout adds conviction, ensuring you trade the hammer candlestick pattern with precision.
Boosting Accuracy with Confluence
The hammer candlestick pattern shines brighter with confluence—overlapping signals that validate its message. Overlay Fibonacci retracement on the downtrend—say, 1.3100 to 1.2900 on GBP/USD. If the hammer’s low (1.2870) hits the 61.8% level (1.2878), it’s a hotspot for reversal, blending two tools seamlessly.
Support zones from past price action amplify this. If 1.2870 was a prior low where buyers emerged, the hammer there gains weight. Moving averages, like the 50-period, can align with the hammer’s body, acting as dynamic support—price bouncing off this line post-hammer signals strength. In 2025, with markets reacting to economic releases, such confluence turns the hammer candlestick pattern into a high-probability play.
Avoiding Missteps with the Hammer
Even with its clarity, the hammer candlestick pattern can mislead if misread. Acting without confirmation is a common error—buying the hammer alone risks a false reversal if the downtrend persists. Wait for that next bullish candle or indicator shift. Ignoring context is another trap; a hammer mid-downtrend or in choppy markets lacks power—ensure it’s at a trend’s end.
Overlooking wick size can also confuse. A lower wick less than twice the body isn’t a true hammer—stick to the classic shape. In 2025’s fast markets, patience prevents these pitfalls, keeping your trades aligned with the pattern’s intent.
Practice and Refinement
Mastery requires hands-on experience. Test the hammer candlestick pattern on a demo account—spot it on pairs like USD/CAD or stocks like Tesla. Simulate trades, noting how confirmation and confluence affect outcomes. Review weekly, tweaking based on data—did volume matter? Did Fib levels help?—to hone your approach. Start live with small positions, scaling as you perfect it.
Hammer Your Way to Success
The hammer candlestick pattern is a trader’s beacon, illuminating reversal points in 2025’s volatile markets. By understanding its shape, trading it with confirmation, and enhancing it with confluence, you turn a simple candle into a powerful tool. Practice transforms this knowledge into skill, paving the way for consistent wins. Embrace the hammer, and watch your trading confidence soar.
For more patterns and trading wisdom, follow Forex Market Solutions – your guide to mastering the markets in 2025 and beyond.
