Technical analysis forms the backbone of successful trading, offering traders a way to decode price movements and anticipate market shifts. Among the many chart patterns available, the rising wedge pattern stands out as a versatile and reliable tool, particularly for those navigating the volatile markets of 2025. This pattern, characterized by converging trendlines sloping upward, often signals an impending reversal or continuation, depending on the context. For traders in Forex, stocks, or cryptocurrencies, understanding this formation can unlock opportunities to enter or exit trades with precision. This comprehensive guide delves into the intricacies of the rising wedge pattern, exploring its structure, significance, and practical applications in today’s financial landscape.

The allure of the rising wedge pattern lies in its ability to reflect market psychology—optimism giving way to hesitation, often followed by a sharp move. In 2025, with economic recovery, interest rate adjustments, and geopolitical events driving volatility, recognizing this pattern becomes a valuable skill for traders aiming to stay ahead. Whether you’re a beginner learning the ropes or a seasoned trader refining your strategy, this article provides a clear roadmap to identify, interpret, and trade the rising wedge pattern effectively, enhancing your decision-making in the markets.
Understanding the Structure of the Rising Wedge
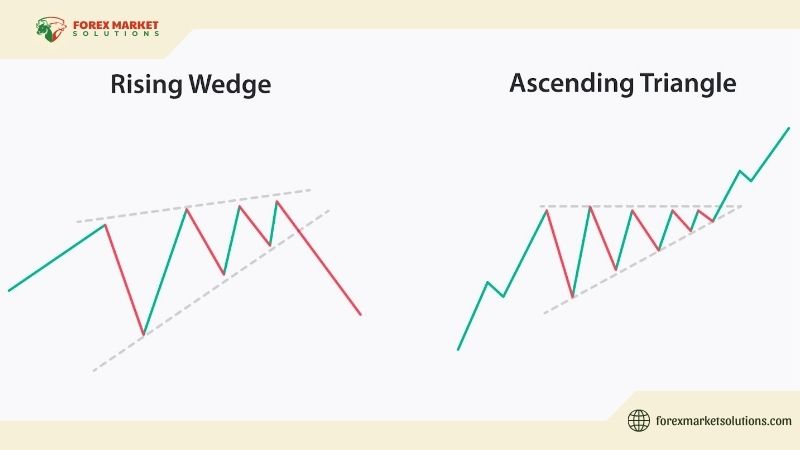
To harness the power of the rising wedge pattern, it’s essential to first grasp its anatomy. This formation emerges when price action creates two upward-sloping trendlines that gradually converge. The upper trendline connects a series of higher highs, while the lower trendline links higher lows, forming a narrowing wedge. Unlike a symmetrical triangle, where the slopes are equal, the rising wedge tilts upward, reflecting a tightening range as prices climb.
This pattern typically appears in two contexts: as a bearish reversal at the end of an uptrend or as a continuation within a downtrend. In an uptrend, it suggests buyers are losing steam—each rally weakens, and selling pressure builds, foreshadowing a potential drop. In a downtrend, it acts as a pause, with prices briefly rising before resuming their descent. The converging lines signal indecision, a tug-of-war between bulls and bears that resolves with a breakout, usually downward. Recognizing these dynamics lays the foundation for trading the rising wedge pattern with confidence.
Volume plays a supporting role in this formation. As the wedge develops, trading volume often declines, reflecting waning momentum. A spike in volume on the breakout—typically below the lower trendline—confirms the move, adding weight to the pattern’s predictive power. This combination of price and volume cues makes the rising wedge pattern a favorite among technical traders.

Spotting the Rising Wedge in Real-Time
Identifying the rising wedge pattern on a chart requires patience and practice, but the process is straightforward once you know what to look for. Start by selecting your timeframe—daily or hourly charts work well for Forex pairs like EUR/USD or stocks like Apple, while shorter frames suit scalpers. Scan for an upward price movement where highs and lows incrementally rise but begin to squeeze together.
Draw the upper trendline by connecting at least two higher highs—say, 1.1200 and 1.1250 on EUR/USD. Then, link two higher lows—perhaps 1.1150 and 1.1180—with the lower trendline. Ensure the lines converge; if they’re parallel or diverging, it’s not a rising wedge. The pattern needs at least four touchpoints (two on each line) to be valid, though more contacts strengthen its reliability. In 2025’s fast-moving markets, driven by economic data and algo-trading, this visual confirmation is your first step to mastering the rising wedge pattern.
Check volume trends as the wedge forms. A gradual drop signals fading enthusiasm, a hallmark of the pattern. Platforms like TradingView or MetaTrader make this easy—overlay a volume indicator to spot the decline. Once the wedge takes shape, watch for the breakout, typically downward, as the price breaches the lower trendline with conviction.
Rising Wedge Pattern: Trading Strategies
Trading the rising wedge pattern effectively hinges on understanding its implications and timing your moves. In a bearish reversal scenario—common at uptrend peaks—the pattern signals a sell opportunity. Suppose USD/JPY climbs from 145.00 to 148.00 over weeks, forming a rising wedge with highs at 147.50 and 148.00, and lows at 146.20 and 146.80. As the price nears the apex and volume wanes, prepare for a break below the lower line—say, at 146.50. Enter a short trade here, setting a stop-loss above the upper trendline (148.20) to limit risk.
Calculate your target by measuring the wedge’s height at its widest point—here, 148.00 minus 146.20 equals 1.80 points (180 pips). Subtract this from the breakout point (146.50), aiming for 144.70. This 1:2 risk-reward ratio—risking 70 pips to gain 180—aligns with safe trading principles. In 2025, with yen volatility tied to Bank of Japan policies, such setups could be frequent, making the rising wedge pattern a go-to tool.
In a downtrend continuation, the approach shifts slightly. Picture GBP/USD in a bearish trend, dropping from 1.3000 to 1.2800, then rallying to 1.2900 in a rising wedge. The highs (1.2880, 1.2900) and lows (1.2830, 1.2850) converge, and a break below 1.2840 signals the downtrend’s resumption. Short at the breakout, with a stop above 1.2910 and a target near 1.2760 (wedge height of 80 pips subtracted from 1.2840). This method leverages the pattern’s bearish bias, amplified by 2025’s expected economic uncertainty.
Confirmation enhances accuracy. Pair the breakout with a bearish candlestick—like a shooting star—or an RSI divergence (price rises, RSI falls) to filter false signals. Volume surge on the break adds further conviction, ensuring you trade the rising wedge pattern with precision.
Enhancing the Pattern with Confluence
The rising wedge pattern gains potency when combined with other tools, a concept known as confluence. Overlay Fibonacci retracement on the prior uptrend—say, from 145.00 to 148.00 on USD/JPY. If the 61.8% level (146.36) aligns with the lower wedge line at breakout, it’s a stronger sell signal. This overlap boosts confidence, as multiple factors point to reversal.
Support and resistance zones from past price action also reinforce the pattern. If 146.50 was a prior support-turned-resistance, a wedge break there carries extra weight. Moving averages, like the 50-day, can act as dynamic targets—price often falls to this line post-breakout. In 2025’s tech-driven markets, where algos react to such levels, confluence sharpens your edge.
Volume analysis seals the deal. A quiet buildup followed by a breakout spike—visible on TradingView’s volume bars—confirms market intent. This layered approach turns the rising wedge pattern into a high-probability setup.
Avoiding Common Mistakes
Even with a clear grasp of the rising wedge pattern, missteps can occur. One pitfall is acting too soon—entering before the breakout risks a false move as price oscillates within the wedge. Wait for the lower line breach and confirmation to avoid traps. Misidentifying the pattern is another error; if lines diverge or volume rises throughout, it’s not a rising wedge—reassess your chart.
Overlooking context can also mislead. A rising wedge in a strong bull market might not reverse—check the broader trend with a 200-day moving average. In 2025, with mixed economic signals, this step prevents premature bearish bets. Patience and discipline keep you aligned with the pattern’s true signal.

Practice and Mastery
Mastery comes through repetition. Test the rising wedge pattern on a demo account, spotting it on pairs like EUR/USD or stocks like Tesla. Simulate trades, tracking breakouts and targets to build intuition. Review outcomes weekly—did volume confirm? Did confluence help?—refining your approach. Transition to live trading with small positions, scaling as confidence grows.
Harness the Rising Wedge
The rising wedge pattern is a trader’s ally, offering clarity in chaotic markets. By identifying its shape, trading its breakouts, and enhancing it with confluence, you can navigate 2025’s volatility with skill. This pattern doesn’t just predict—it empowers, turning price action into profit potential. Embrace it, practice it, and watch your trading soar.
For more strategies and market insights, follow Forex Market Solutions – your guide to thriving in 2025 and beyond.
